Masked Lapwing
Vanellus miles
ABR description
The following is extracted from the Annual Bird Report for the twelve months to June 2017.
Common, breeding resident
Well distributed throughout the ACT in suitable grassy areas.
General: The reporting rate for this species declined gradually from 1984 (35.6%) to 2001 (6.1%) but since 2001 has risen gradually to 14.6%, indicating that the species is doing well in the COG AoI. Max 73/17 Jun LBath (LeM1), mean 4.2, and median 2. Most records from the wetlands and open grassy areas widely spread throughout the COG AoI. Records were throughout the year: winter 18%, spring 26%, summer 32% and autumn 24%. 135 breeding records from 19 grid cells, a large increase over previous years: earliest ne/16 Jul Goulburn Wetlands (AnF1) and latest dy/17 Jan FSP (HoS1).
GBS: 200 records from 22 sites is a further drop from the record high of 3 years ago. Max 11/3wk Jan Pearce (KrS1), mean and median 2. Records spread evenly throughout the year. 11 breeding records (cf 17 last year and 25 the year before), from 1 site (Greenway): earliest nb/2wk Jul and latest dy/2wk Oct (HaA2).

Abundance
Abundance is the average number of birds of that species per survey. Where the species was observed (presence recorded) but the number of birds seen was not recorded, this is treated as a count of zero.
Abundance by year
This chart shows the abundance of Masked Lapwing between 1982 and 2017. 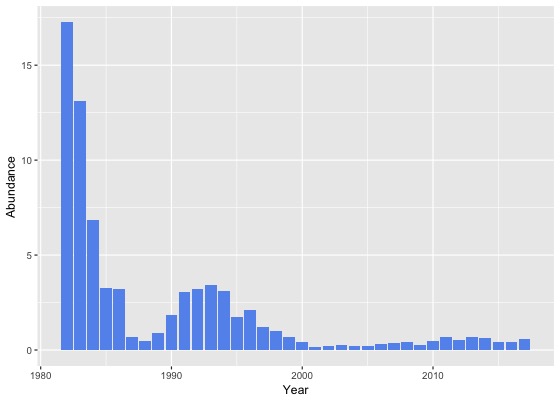
Abundance by month
This chart shows the monthly abundance of Masked Lapwing. The blue lines show the abundance for the twelve months to June 2017 and the bars show the average abundance for the period 1982 to 2017. 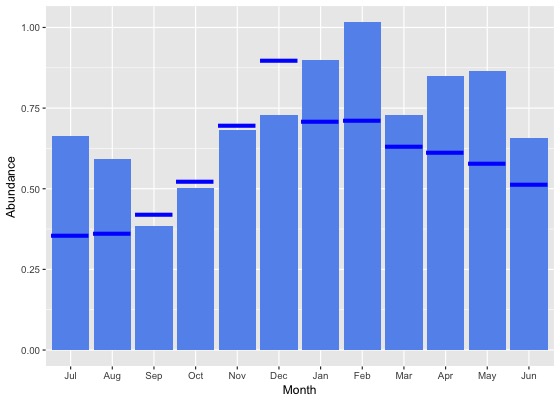
Abundance by season
This chart shows the seasonal abundance of Masked Lapwing. The blue lines show the seasonal abundance for the twelve months to June 2017 and the bars show the average seasonal abundance for the period 1982 to 2017. 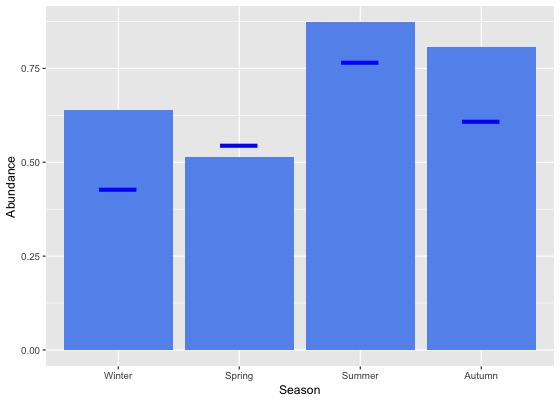
Abundance data
| Month | Season | ||||||||||||||||||
|---|---|---|---|---|---|---|---|---|---|---|---|---|---|---|---|---|---|---|---|
| Period | Jul | Aug | Sep | Oct | Nov | Dec | Jan | Feb | Mar | Apr | May | Jun | Winter | Spring | Summer | Autumn | All | ||
| All years | |||||||||||||||||||
| All | 0.7 | 0.6 | 0.4 | 0.5 | 0.7 | 0.7 | 0.9 | 1.0 | 0.7 | 0.8 | 0.9 | 0.7 | 0.6 | 0.5 | 0.9 | 0.8 | 0.7 | ||
| Previous years | |||||||||||||||||||
| All previous years | 0.7 | 0.6 | 0.4 | 0.5 | 0.7 | 0.7 | 0.9 | 1.1 | 0.7 | 0.9 | 0.9 | 0.7 | 0.7 | 0.5 | 0.9 | 0.8 | 0.7 | ||
| Previous 30 years | 0.6 | 0.6 | 0.3 | 0.5 | 0.6 | 0.6 | 0.9 | 1.0 | 0.7 | 0.8 | 0.8 | 0.6 | 0.6 | 0.5 | 0.8 | 0.8 | 0.7 | ||
| Previous 20 years | 0.5 | 0.5 | 0.3 | 0.4 | 0.5 | 0.4 | 0.6 | 0.6 | 0.5 | 0.4 | 0.6 | 0.4 | 0.5 | 0.4 | 0.5 | 0.5 | 0.5 | ||
| 10 year groups | |||||||||||||||||||
| [2007,2017) | 0.5 | 0.5 | 0.4 | 0.4 | 0.6 | 0.4 | 0.6 | 0.6 | 0.4 | 0.5 | 0.6 | 0.5 | 0.5 | 0.4 | 0.5 | 0.5 | 0.5 | ||
| [1997,2007) | 0.3 | 0.4 | 0.2 | 0.3 | 0.3 | 0.4 | 0.6 | 0.7 | 0.6 | 0.2 | 0.4 | 0.3 | 0.3 | 0.2 | 0.5 | 0.4 | 0.4 | ||
| [1987,1997) | 1.2 | 0.8 | 0.7 | 1.0 | 1.2 | 1.9 | 2.5 | 2.6 | 2.1 | 2.6 | 1.6 | 1.2 | 1.0 | 1.0 | 2.3 | 2.1 | 1.6 | ||
| 5 year groups | |||||||||||||||||||
| [2012,2017) | 0.6 | 0.6 | 0.4 | 0.4 | 0.6 | 0.5 | 0.5 | 0.5 | 0.5 | 0.4 | 0.6 | 0.6 | 0.6 | 0.5 | 0.5 | 0.5 | 0.5 | ||
| [2007,2012) | 0.4 | 0.4 | 0.3 | 0.4 | 0.5 | 0.2 | 0.8 | 0.8 | 0.2 | 0.6 | 0.8 | 0.4 | 0.4 | 0.4 | 0.6 | 0.5 | 0.5 | ||
| [2002,2007) | 0.3 | 0.3 | 0.1 | 0.2 | 0.1 | 0.2 | 0.7 | 0.2 | 0.2 | 0.3 | 0.6 | 0.1 | 0.2 | 0.2 | 0.3 | 0.3 | 0.3 | ||
| [1997,2002) | 0.4 | 0.5 | 0.2 | 0.3 | 0.4 | 0.6 | 0.6 | 1.2 | 1.0 | 0.2 | 0.3 | 0.6 | 0.5 | 0.3 | 0.8 | 0.5 | 0.5 | ||
| [1992,1997) | 2.4 | 1.1 | 1.0 | 1.4 | 2.2 | 3.1 | 4.4 | 4.7 | 3.9 | 3.5 | 2.5 | 1.9 | 1.7 | 1.6 | 4.0 | 3.3 | 2.6 | ||
| [1987,1992) | 0.7 | 0.6 | 0.5 | 0.7 | 0.7 | 1.3 | 1.4 | 1.8 | 1.1 | 2.0 | 1.2 | 0.8 | 0.7 | 0.7 | 1.5 | 1.4 | 1.0 | ||
| Year | |||||||||||||||||||
| 2017 | 0.4 | 0.4 | 0.4 | 0.5 | 0.7 | 0.9 | 0.7 | 0.7 | 0.6 | 0.6 | 0.6 | 0.5 | 0.4 | 0.5 | 0.8 | 0.6 | 0.6 | ||
| 2016 | 0.5 | 0.4 | 0.4 | 0.5 | 0.5 | 0.4 | 0.5 | 0.4 | 0.5 | 0.4 | 0.5 | 0.5 | 0.5 | 0.5 | 0.4 | 0.4 | 0.4 | ||
| 2015 | 0.7 | 0.5 | 0.4 | 0.4 | 0.5 | 0.3 | 0.4 | 0.5 | 0.2 | 0.3 | 0.4 | 0.4 | 0.5 | 0.4 | 0.4 | 0.3 | 0.4 | ||
| 2014 | 0.7 | 0.6 | 0.4 | 0.5 | 0.5 | 0.9 | 0.8 | 0.7 | 0.8 | 0.6 | 0.7 | 0.4 | 0.5 | 0.5 | 0.8 | 0.7 | 0.6 | ||
| 2013 | 0.8 | 0.9 | 0.4 | 0.3 | 0.7 | 0.9 | 0.7 | 0.7 | 0.6 | 0.8 | 0.8 | 1.1 | 0.9 | 0.5 | 0.8 | 0.7 | 0.7 | ||
| 2012 | 0.5 | 0.8 | 0.3 | 0.4 | 0.8 | 0.3 | 0.3 | 0.9 | 0.7 | 0.3 | 0.8 | 0.9 | 0.7 | 0.5 | 0.4 | 0.5 | 0.5 | ||
| 2011 | 0.8 | 0.5 | 0.3 | 0.3 | 0.7 | 0.3 | 1.3 | 1.5 | 0.1 | 1.3 | 1.5 | 0.3 | 0.4 | 0.4 | 1.0 | 0.9 | 0.7 | ||
| 2010 | 0.1 | 0.5 | 0.6 | 0.4 | 0.2 | 0.3 | 0.4 | 0.7 | 0.4 | 0.9 | 0.8 | 0.5 | 0.4 | 0.4 | 0.4 | 0.7 | 0.5 | ||
| 2009 | 0.4 | 0.2 | 0.2 | 0.2 | 0.3 | 0.1 | 0.6 | 0.2 | 0.3 | 0.2 | 0.3 | 0.2 | 0.3 | 0.3 | 0.3 | 0.2 | 0.3 | ||
| 2008 | 0.0 | 0.3 | 0.2 | 0.4 | 0.7 | 0.1 | 1.2 | 0.8 | 0.4 | 0.2 | 0.5 | 1.0 | 0.5 | 0.4 | 0.6 | 0.3 | 0.4 | ||
| 2007 | 0.5 | 0.7 | 0.1 | 0.5 | 0.6 | 0.2 | 0.5 | 0.5 | 0.1 | 0.4 | 0.3 | 0.1 | 0.3 | 0.4 | 0.4 | 0.3 | 0.4 | ||
| 2006 | 0.2 | 0.5 | 0.2 | 0.3 | 0.3 | 0.2 | 1.1 | 0.5 | 0.2 | 0.3 | 0.3 | 0.2 | 0.3 | 0.3 | 0.6 | 0.2 | 0.3 | ||
| 2005 | 0.6 | 0.3 | 0.1 | 0.2 | 0.1 | 0.1 | 0.2 | 0.2 | 0.1 | 0.1 | 0.6 | 0.0 | 0.2 | 0.1 | 0.2 | 0.3 | 0.2 | ||
| 2004 | 0.2 | 0.2 | 0.1 | 0.1 | 0.1 | 0.1 | 0.4 | 0.3 | 0.8 | 0.1 | 0.3 | 0.1 | 0.2 | 0.1 | 0.3 | 0.4 | 0.2 | ||
| 2003 | 0.6 | 0.4 | 0.1 | 0.1 | 0.1 | 0.1 | 0.5 | 0.2 | 0.1 | 0.6 | 1.2 | 0.1 | 0.3 | 0.1 | 0.2 | 0.5 | 0.3 | ||
| 2002 | 0.1 | 0.4 | 0.1 | 0.4 | 0.1 | 0.2 | 0.9 | 0.1 | 0.1 | 0.1 | 0.5 | 0.0 | 0.1 | 0.2 | 0.4 | 0.2 | 0.2 | ||
| 2001 | 0.1 | 0.1 | 0.1 | 0.1 | 0.4 | 0.0 | 0.3 | 0.1 | 0.3 | 0.2 | 0.1 | 0.1 | 0.1 | 0.2 | 0.1 | 0.2 | 0.2 | ||
| 2000 | 0.4 | 0.2 | 0.1 | 0.1 | 0.3 | 0.3 | 0.7 | 0.6 | 1.5 | 0.2 | 0.1 | 0.1 | 0.2 | 0.2 | 0.5 | 0.7 | 0.4 | ||
| 1999 | 2.3 | 0.7 | 0.3 | 0.4 | 0.1 | 0.6 | 0.4 | 0.5 | 1.9 | 0.2 | 0.2 | 1.4 | 1.3 | 0.3 | 0.5 | 0.8 | 0.7 | ||
| 1998 | 0.2 | 1.6 | 0.4 | 0.9 | 0.6 | 1.2 | 1.0 | 4.8 | 0.5 | 0.0 | 0.4 | 1.1 | 1.0 | 0.6 | 2.0 | 0.4 | 1.0 | ||
| 1997 | 0.4 | 1.1 | 0.6 | 0.9 | 0.8 | 2.4 | 0.7 | 6.1 | 1.5 | 0.2 | 1.2 | 0.1 | 0.5 | 0.8 | 3.0 | 0.7 | 1.2 | ||
| 1996 | 1.4 | 1.4 | 0.6 | 1.1 | 1.8 | 2.5 | 3.1 | 3.5 | 2.0 | 2.7 | 1.6 | 3.6 | 2.2 | 1.2 | 3.0 | 2.1 | 2.1 | ||
| 1995 | 2.6 | 0.7 | 0.4 | 0.6 | 0.8 | 2.4 | 3.5 | 0.3 | 4.5 | 2.1 | 2.6 | 0.9 | 1.3 | 0.6 | 2.3 | 3.0 | 1.7 | ||
| 1994 | 3.2 | 2.1 | 0.8 | 1.8 | 2.8 | 1.7 | 7.5 | 1.3 | 4.9 | 4.1 | 4.5 | 1.4 | 2.1 | 2.0 | 3.8 | 4.4 | 3.1 | ||
| 1993 | 1.6 | 1.0 | 0.8 | 2.9 | 3.5 | 3.4 | 6.3 | 19.4 | 2.8 | 6.4 | 1.0 | 1.7 | 1.4 | 2.5 | 8.6 | 3.2 | 3.4 | ||
| 1992 | 3.0 | 0.3 | 2.5 | 1.8 | 2.9 | 6.2 | 2.9 | 7.0 | 5.6 | 3.4 | 2.4 | 2.0 | 1.8 | 2.4 | 5.2 | 3.8 | 3.2 | ||
| 1991 | 0.6 | 1.5 | 0.8 | 2.1 | 3.7 | 2.0 | 8.5 | 10.6 | 4.4 | 5.8 | 2.2 | 1.2 | 1.0 | 2.3 | 6.4 | 4.1 | 3.1 | ||
| 1990 | 0.7 | 0.4 | 0.6 | 0.6 | 0.3 | 3.5 | 3.6 | 4.4 | 1.3 | 6.8 | 3.0 | 0.9 | 0.6 | 0.5 | 3.8 | 3.7 | 1.8 | ||
| 1989 | 0.4 | 0.5 | 0.5 | 0.7 | 0.7 | 1.1 | 0.5 | 1.1 | 1.1 | 2.1 | 1.8 | 0.8 | 0.6 | 0.6 | 0.9 | 1.7 | 0.9 | ||
| 1988 | 0.3 | 0.4 | 0.4 | 0.4 | 0.2 | 1.1 | 0.3 | 0.5 | 0.3 | 0.5 | 0.6 | 0.6 | 0.4 | 0.3 | 0.6 | 0.5 | 0.5 | ||
| 1987 | 12.1 | 2.7 | 0.4 | 0.6 | 0.5 | 0.8 | 0.7 | 0.7 | 0.8 | 0.5 | 0.5 | 0.8 | 1.5 | 0.5 | 0.8 | 0.6 | 0.7 | ||
| 1986 | 1.6 | 4.7 | 1.2 | 2.7 | 1.1 | 2.4 | 5.0 | 3.7 | 3.1 | 3.1 | 7.5 | 4.7 | 3.9 | 1.6 | 3.5 | 4.2 | 3.2 | ||
| 1985 | 5.4 | 1.1 | 0.4 | 1.1 | 2.7 | 1.8 | 22.2 | 8.7 | 9.2 | 5.0 | 3.2 | 7.4 | 4.6 | 1.3 | 5.1 | 5.7 | 3.3 | ||
| 1984 | 14.8 | 8.7 | 9.6 | 12.5 | 16.0 | 18.0 | 5.5 | 6.0 | 0.0 | 4.5 | 9.1 | 5.5 | 7.1 | 12.5 | 7.7 | 4.7 | 6.8 | ||
| 1983 | 33.3 | 5.4 | 26.8 | 7.7 | 9.9 | 9.1 | 15.5 | 10.7 | 32.5 | - | 19.3 | 8.9 | 12.5 | 12.0 | 11.0 | 21.2 | 13.1 | ||
| 1982 | - | 4.0 | - | 0.0 | 3.0 | 15.1 | - | 9.7 | - | 45.5 | - | 18.9 | 12.4 | 2.7 | 12.7 | 45.5 | 17.2 | ||
Reporting rates
Reporting rate is the proportion of all surveys in which the species was present.
Reporting rate by year
This chart shows the reporting rate of Masked Lapwing each year between 1982 and 2017. 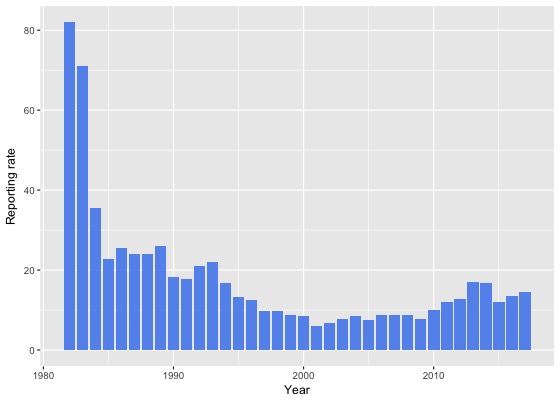
Reporting rate by month
This chart shows the reporting rate by month of Masked Lapwing. The blue lines show the reporting rate for the twelve months to June 2017 and the bars show the average reporting rate for the period 1982 to 2017. 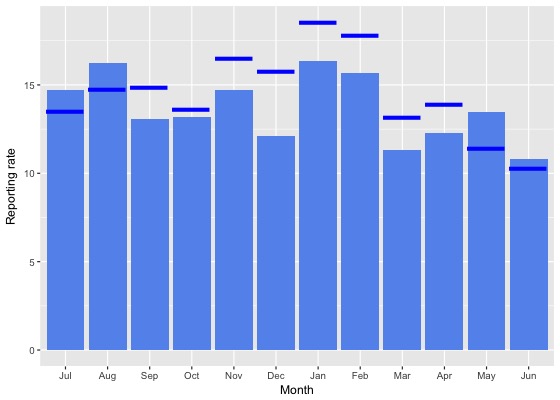
Reporting rate by season
This chart shows the seasonal reporting rate of Masked Lapwing. The blue lines show the seasonal reporting rate for the twelve months to June 2017 and the bars show the average seasonal reporting rate for the period 1982 to 2017. 
Reporting rate data
| Month | Season | ||||||||||||||||||
|---|---|---|---|---|---|---|---|---|---|---|---|---|---|---|---|---|---|---|---|
| Period | Jul | Aug | Sep | Oct | Nov | Dec | Jan | Feb | Mar | Apr | May | Jun | Winter | Spring | Summer | Autumn | All | ||
| All years | |||||||||||||||||||
| All | 14.7 | 16.2 | 13.1 | 13.2 | 14.7 | 12.1 | 16.4 | 15.7 | 11.3 | 12.3 | 13.5 | 10.8 | 13.6 | 13.6 | 14.7 | 12.2 | 13.5 | ||
| Previous years | |||||||||||||||||||
| All previous years | 14.9 | 16.5 | 12.8 | 13.1 | 14.4 | 11.6 | 15.9 | 15.2 | 11.0 | 12.0 | 14.0 | 10.9 | 13.8 | 13.4 | 14.2 | 12.1 | 13.3 | ||
| Previous 30 years | 14.7 | 16.0 | 12.7 | 12.9 | 14.2 | 11.0 | 15.8 | 14.6 | 10.9 | 11.5 | 13.8 | 10.3 | 13.3 | 13.2 | 13.8 | 11.9 | 13.0 | ||
| Previous 20 years | 12.9 | 14.6 | 11.0 | 11.4 | 12.6 | 9.3 | 15.1 | 12.8 | 9.5 | 9.0 | 12.0 | 8.3 | 11.4 | 11.6 | 12.4 | 9.9 | 11.4 | ||
| 10 year groups | |||||||||||||||||||
| [2007,2017) | 15.5 | 16.4 | 13.2 | 11.9 | 15.6 | 10.8 | 15.8 | 13.4 | 10.7 | 10.1 | 13.6 | 10.0 | 13.3 | 13.1 | 13.5 | 11.2 | 12.8 | ||
| [1997,2007) | 8.5 | 10.6 | 6.8 | 9.7 | 6.7 | 6.6 | 12.9 | 11.3 | 6.8 | 6.3 | 8.3 | 4.5 | 7.4 | 7.8 | 9.7 | 6.9 | 8.0 | ||
| [1987,1997) | 21.0 | 20.1 | 21.5 | 21.7 | 19.4 | 20.4 | 19.7 | 23.2 | 19.0 | 24.4 | 20.4 | 20.7 | 20.6 | 20.8 | 21.0 | 21.3 | 20.9 | ||
| 5 year groups | |||||||||||||||||||
| [2012,2017) | 17.2 | 17.5 | 14.8 | 13.0 | 17.4 | 12.1 | 15.9 | 13.8 | 12.3 | 11.7 | 13.7 | 11.8 | 15.1 | 14.7 | 14.2 | 12.4 | 14.0 | ||
| [2007,2012) | 10.6 | 12.4 | 9.4 | 10.0 | 10.6 | 8.0 | 15.3 | 11.9 | 6.5 | 6.4 | 13.3 | 6.8 | 9.0 | 10.0 | 11.4 | 8.0 | 9.6 | ||
| [2002,2007) | 7.5 | 10.7 | 5.9 | 9.8 | 6.5 | 6.1 | 15.9 | 12.1 | 6.4 | 5.4 | 9.1 | 4.0 | 6.8 | 7.5 | 10.5 | 6.7 | 7.9 | ||
| [1997,2002) | 10.2 | 10.6 | 7.9 | 9.5 | 6.8 | 7.2 | 9.6 | 10.4 | 7.3 | 7.2 | 7.2 | 5.2 | 8.2 | 8.1 | 8.8 | 7.2 | 8.1 | ||
| [1992,1997) | 21.2 | 15.5 | 13.0 | 17.3 | 15.9 | 15.2 | 19.9 | 16.1 | 14.8 | 18.9 | 16.0 | 13.8 | 16.5 | 15.6 | 17.3 | 16.6 | 16.4 | ||
| [1987,1992) | 20.9 | 22.7 | 25.5 | 24.2 | 21.1 | 22.6 | 19.6 | 25.9 | 21.4 | 27.5 | 22.6 | 24.7 | 22.7 | 23.4 | 22.7 | 23.9 | 23.2 | ||
| Year | |||||||||||||||||||
| 2017 | 13.5 | 14.7 | 14.8 | 13.6 | 16.5 | 15.8 | 18.5 | 17.8 | 13.1 | 13.9 | 11.4 | 10.3 | 12.5 | 14.9 | 17.5 | 12.8 | 14.6 | ||
| 2016 | 14.8 | 15.8 | 13.9 | 14.8 | 17.6 | 12.1 | 14.0 | 12.5 | 12.7 | 10.3 | 12.8 | 14.2 | 15.0 | 15.2 | 13.0 | 11.8 | 13.6 | ||
| 2015 | 21.4 | 19.2 | 15.2 | 12.9 | 16.2 | 9.4 | 10.5 | 10.8 | 9.0 | 9.6 | 11.0 | 7.1 | 14.3 | 14.5 | 10.2 | 9.7 | 12.1 | ||
| 2014 | 20.6 | 19.7 | 17.7 | 11.8 | 15.6 | 16.6 | 24.0 | 15.9 | 13.3 | 16.4 | 15.4 | 14.9 | 17.6 | 14.3 | 20.1 | 14.8 | 16.7 | ||
| 2013 | 20.0 | 20.8 | 15.6 | 12.7 | 23.1 | 14.9 | 23.3 | 18.5 | 14.7 | 15.6 | 15.5 | 14.1 | 18.0 | 16.4 | 18.8 | 15.2 | 17.1 | ||
| 2012 | 11.1 | 15.0 | 13.0 | 11.6 | 14.8 | 9.7 | 11.7 | 18.5 | 13.1 | 11.0 | 20.9 | 11.4 | 12.4 | 12.7 | 12.3 | 13.9 | 12.8 | ||
| 2011 | 15.4 | 12.0 | 13.6 | 11.9 | 9.7 | 11.3 | 17.2 | 16.0 | 10.0 | 5.6 | 15.6 | 9.3 | 11.1 | 12.0 | 14.7 | 10.2 | 12.1 | ||
| 2010 | 7.3 | 12.3 | 11.2 | 10.5 | 10.5 | 9.8 | 16.9 | 15.3 | 7.1 | 6.4 | 9.8 | 7.6 | 8.7 | 10.7 | 13.2 | 7.3 | 10.1 | ||
| 2009 | 9.4 | 14.6 | 6.4 | 7.2 | 8.5 | 4.2 | 13.3 | 9.2 | 5.1 | 7.4 | 9.2 | 6.3 | 9.0 | 7.3 | 8.5 | 6.9 | 7.7 | ||
| 2008 | 5.5 | 12.2 | 10.1 | 9.8 | 14.1 | 5.9 | 15.9 | 9.3 | 4.8 | 6.2 | 13.5 | 4.7 | 6.8 | 10.5 | 9.4 | 7.1 | 8.8 | ||
| 2007 | 17.6 | 11.1 | 5.4 | 11.1 | 11.5 | 6.4 | 12.2 | 7.0 | 3.8 | 6.8 | 15.4 | 5.2 | 8.7 | 9.5 | 8.7 | 7.4 | 8.7 | ||
| 2006 | 7.9 | 11.7 | 4.4 | 9.7 | 6.0 | 6.7 | 20.8 | 22.2 | 6.7 | 5.4 | 10.1 | 3.1 | 6.2 | 7.4 | 16.1 | 7.1 | 8.8 | ||
| 2005 | 7.4 | 14.0 | 5.2 | 12.2 | 5.5 | 4.0 | 12.8 | 13.0 | 6.1 | 6.0 | 9.5 | 4.2 | 7.1 | 7.4 | 8.3 | 7.2 | 7.5 | ||
| 2004 | 9.1 | 9.2 | 7.2 | 9.3 | 8.7 | 6.5 | 15.2 | 10.1 | 10.4 | 4.9 | 5.8 | 4.9 | 7.9 | 8.3 | 10.2 | 7.3 | 8.4 | ||
| 2003 | 8.5 | 7.2 | 7.6 | 9.3 | 8.3 | 5.9 | 12.6 | 8.2 | 6.3 | 6.9 | 8.5 | 5.6 | 7.0 | 8.3 | 8.3 | 7.0 | 7.7 | ||
| 2002 | 4.0 | 12.7 | 5.0 | 9.0 | 4.0 | 7.1 | 17.0 | 8.6 | 2.7 | 3.6 | 11.8 | 2.7 | 5.6 | 6.2 | 9.8 | 4.7 | 6.8 | ||
| 2001 | 5.3 | 6.6 | 7.4 | 5.0 | 7.4 | 4.3 | 7.0 | 7.7 | 4.8 | 9.8 | 5.2 | 3.4 | 5.1 | 6.7 | 6.1 | 6.3 | 6.1 | ||
| 2000 | 16.7 | 11.8 | 6.5 | 11.0 | 8.8 | 4.7 | 7.4 | 9.5 | 9.4 | 7.5 | 8.2 | 5.9 | 10.8 | 8.8 | 6.9 | 8.4 | 8.5 | ||
| 1999 | 20.6 | 13.4 | 7.5 | 8.2 | 5.8 | 13.1 | 11.7 | 7.9 | 8.6 | 7.2 | 8.0 | 7.0 | 10.1 | 7.2 | 11.0 | 7.9 | 8.9 | ||
| 1998 | 8.1 | 13.2 | 7.3 | 14.1 | 6.2 | 11.3 | 16.2 | 15.1 | 5.4 | 0.0 | 18.5 | 6.7 | 9.1 | 8.8 | 13.7 | 6.3 | 9.7 | ||
| 1997 | 10.3 | 12.1 | 13.6 | 15.8 | 4.3 | 8.7 | 15.7 | 24.6 | 12.5 | 4.6 | 2.2 | 1.4 | 7.8 | 10.6 | 14.6 | 5.7 | 9.8 | ||
| 1996 | 14.9 | 14.9 | 6.7 | 7.9 | 8.3 | 10.1 | 17.5 | 14.1 | 9.8 | 14.1 | 22.4 | 16.1 | 15.3 | 7.7 | 13.9 | 14.3 | 12.6 | ||
| 1995 | 18.3 | 11.6 | 4.9 | 14.0 | 7.3 | 18.4 | 17.7 | 7.9 | 18.4 | 18.5 | 10.4 | 7.4 | 12.3 | 9.5 | 15.6 | 16.4 | 13.1 | ||
| 1994 | 27.5 | 19.5 | 10.3 | 19.8 | 16.9 | 15.2 | 20.6 | 12.1 | 15.9 | 16.8 | 18.8 | 11.2 | 18.0 | 16.2 | 16.3 | 17.1 | 16.9 | ||
| 1993 | 26.5 | 21.8 | 22.6 | 30.7 | 34.8 | 19.6 | 18.4 | 28.1 | 13.6 | 25.0 | 10.4 | 18.8 | 21.9 | 29.6 | 21.3 | 15.6 | 22.0 | ||
| 1992 | 23.1 | 11.1 | 23.5 | 21.3 | 20.8 | 15.9 | 29.3 | 29.3 | 16.9 | 23.7 | 19.7 | 18.3 | 17.9 | 21.9 | 24.1 | 19.9 | 20.9 | ||
| 1991 | 9.4 | 13.8 | 15.1 | 12.6 | 22.7 | 16.2 | 21.4 | 28.0 | 15.9 | 22.0 | 23.0 | 30.0 | 14.8 | 16.8 | 21.1 | 20.2 | 17.7 | ||
| 1990 | 20.0 | 18.4 | 12.9 | 12.2 | 9.3 | 22.2 | 13.9 | 21.1 | 23.9 | 23.8 | 19.2 | 23.7 | 20.0 | 11.4 | 19.1 | 22.4 | 18.1 | ||
| 1989 | 25.0 | 24.1 | 27.1 | 30.8 | 26.3 | 23.9 | 20.2 | 27.8 | 22.2 | 33.3 | 24.3 | 26.2 | 25.0 | 28.2 | 24.0 | 26.9 | 26.1 | ||
| 1988 | 22.8 | 27.6 | 31.5 | 25.8 | 20.1 | 21.5 | 17.6 | 22.9 | 16.8 | 30.5 | 25.3 | 26.1 | 25.6 | 24.9 | 20.6 | 24.0 | 23.9 | ||
| 1987 | 54.5 | 20.0 | 27.9 | 25.0 | 22.1 | 24.6 | 22.6 | 27.5 | 25.8 | 23.0 | 20.1 | 21.1 | 22.6 | 24.7 | 25.1 | 22.9 | 24.1 | ||
| 1986 | 15.4 | 31.6 | 20.8 | 27.8 | 17.0 | 38.2 | 21.7 | 33.3 | 19.4 | 23.5 | 17.2 | 40.0 | 30.3 | 21.3 | 32.3 | 20.7 | 25.5 | ||
| 1985 | 16.7 | 23.3 | 5.8 | 12.8 | 14.0 | 16.7 | 87.5 | 70.6 | 45.5 | 57.9 | 20.0 | 42.9 | 27.3 | 11.3 | 34.1 | 45.0 | 22.8 | ||
| 1984 | 100.0 | 70.0 | 60.0 | 100.0 | 100.0 | 91.7 | 13.8 | 27.3 | 3.7 | 35.3 | 16.1 | 32.4 | 46.9 | 90.5 | 32.4 | 19.6 | 35.6 | ||
| 1983 | 83.3 | 75.0 | 80.0 | 61.5 | 55.6 | 84.6 | 83.3 | 63.6 | 100.0 | - | 75.0 | 54.5 | 69.0 | 63.0 | 76.7 | 78.6 | 71.0 | ||
| 1982 | - | 72.7 | - | 0.0 | 75.0 | 78.6 | - | 90.9 | - | 92.3 | - | 85.7 | 80.0 | 66.7 | 84.0 | 92.3 | 81.9 | ||
Breeding data
Breeding records by month
Number of breeding records by breeding code and month, 2017 and all years| Breeding code | Jul | Aug | Sep | Oct | Nov | Dec | Jan | Feb | Mar | Apr | May | Jun |
|---|---|---|---|---|---|---|---|---|---|---|---|---|
| 2017 | ||||||||||||
| Breeding (BLA code) | 0 | 0 | 0 | 0 | 0 | 0 | 0 | 0 | 0 | 0 | 0 | 0 |
| Carrying Food | 0 | 0 | 0 | 0 | 0 | 0 | 0 | 0 | 0 | 0 | 0 | 0 |
| Copulating | 0 | 0 | 0 | 0 | 0 | 0 | 0 | 0 | 0 | 0 | 0 | 0 |
| Display | 0 | 0 | 0 | 0 | 0 | 0 | 0 | 0 | 0 | 0 | 0 | 0 |
| Dependent young | 0 | 9 | 12 | 22 | 24 | 21 | 2 | 0 | 0 | 0 | 0 | 0 |
| Faecal sac | 0 | 0 | 0 | 0 | 0 | 0 | 0 | 0 | 0 | 0 | 0 | 0 |
| Inspecting hollow | 0 | 0 | 0 | 0 | 0 | 0 | 0 | 0 | 0 | 0 | 0 | 0 |
| Nest building | 0 | 0 | 0 | 2 | 0 | 0 | 0 | 0 | 0 | 0 | 0 | 0 |
| Nest with eggs | 1 | 0 | 0 | 2 | 7 | 0 | 0 | 0 | 0 | 0 | 0 | 0 |
| Nest with young | 0 | 2 | 1 | 0 | 0 | 0 | 0 | 0 | 0 | 0 | 0 | 0 |
| On/leaving nest | 2 | 6 | 8 | 3 | 11 | 0 | 0 | 0 | 0 | 0 | 0 | 0 |
| All years | ||||||||||||
| Breeding (BLA code) | 1 | 5 | 2 | 15 | 0 | 0 | 3 | 0 | 0 | 0 | 0 | 0 |
| Carrying Food | 0 | 0 | 0 | 0 | 0 | 0 | 0 | 0 | 0 | 0 | 0 | 0 |
| Copulating | 1 | 1 | 0 | 0 | 0 | 0 | 0 | 0 | 0 | 0 | 0 | 0 |
| Display | 0 | 1 | 0 | 1 | 0 | 0 | 0 | 0 | 0 | 0 | 0 | 0 |
| Dependent young | 4 | 28 | 43 | 64 | 37 | 32 | 6 | 2 | 0 | 0 | 1 | 0 |
| Faecal sac | 0 | 0 | 0 | 0 | 0 | 0 | 0 | 0 | 0 | 0 | 0 | 0 |
| Inspecting hollow | 0 | 0 | 2 | 0 | 0 | 0 | 0 | 0 | 0 | 0 | 0 | 0 |
| Nest building | 0 | 1 | 7 | 8 | 4 | 2 | 0 | 0 | 0 | 0 | 0 | 0 |
| Nest with eggs | 10 | 9 | 19 | 16 | 13 | 1 | 0 | 0 | 0 | 0 | 0 | 0 |
| Nest with young | 0 | 2 | 4 | 2 | 1 | 1 | 0 | 0 | 0 | 0 | 0 | 0 |
| On/leaving nest | 7 | 17 | 24 | 17 | 17 | 1 | 1 | 0 | 0 | 0 | 0 | 3 |
Breeding records by year
Average number of breeding records per period by breeding code| Period | Breeding (BLA code) | Carrying Food | Copulating | Display | Dependent young | Faecal sac | Inspecting hollow | Nest building | Nest with eggs | Nest with young | On/leaving nest |
|---|---|---|---|---|---|---|---|---|---|---|---|
| All years | |||||||||||
| All | 0.7 | 0.0 | 0.1 | 0.1 | 6.0 | 0.0 | 0.1 | 0.6 | 1.9 | 0.3 | 2.4 |
| Previous years | |||||||||||
| All previous years | 0.7 | 0.0 | 0.1 | 0.1 | 3.6 | 0.0 | 0.1 | 0.6 | 1.7 | 0.2 | 1.6 |
| Previous 30 years | 0.9 | 0.0 | 0.1 | 0.1 | 4.2 | 0.0 | 0.1 | 0.7 | 1.9 | 0.2 | 1.9 |
| Previous 20 years | 1.1 | 0.0 | 0.0 | 0.1 | 4.2 | 0.0 | 0.1 | 0.0 | 0.8 | 0.1 | 2.5 |
| 10 year groups | |||||||||||
| [2007,2017) | 1.8 | 0.0 | 0.0 | 0.2 | 6.6 | 0.0 | 0.2 | 0.0 | 1.2 | 0.2 | 4.4 |
| [1997,2007) | 0.5 | 0.0 | 0.0 | 0.0 | 1.8 | 0.0 | 0.0 | 0.0 | 0.5 | 0.0 | 0.6 |
| [1987,1997) | 0.3 | 0.0 | 0.2 | 0.0 | 4.1 | 0.0 | 0.0 | 2.0 | 4.0 | 0.5 | 0.6 |
| 5 year groups | |||||||||||
| [2012,2017) | 1.2 | 0.0 | 0.0 | 0.2 | 7.4 | 0.0 | 0.4 | 0.0 | 2.0 | 0.4 | 5.6 |
| [2007,2012) | 2.4 | 0.0 | 0.0 | 0.2 | 5.8 | 0.0 | 0.0 | 0.0 | 0.4 | 0.0 | 3.2 |
| [2002,2007) | 0.4 | 0.0 | 0.0 | 0.0 | 1.8 | 0.0 | 0.0 | 0.0 | 0.8 | 0.0 | 0.6 |
| [1997,2002) | 0.6 | 0.0 | 0.0 | 0.0 | 1.8 | 0.0 | 0.0 | 0.0 | 0.2 | 0.0 | 0.6 |
| [1992,1997) | 0.6 | 0.0 | 0.4 | 0.0 | 1.6 | 0.0 | 0.0 | 0.0 | 0.4 | 0.0 | 1.0 |
| [1987,1992) | 0.0 | 0.0 | 0.0 | 0.0 | 6.6 | 0.0 | 0.0 | 4.0 | 7.6 | 1.0 | 0.2 |
| Year | |||||||||||
| 2017 | 0.0 | 0.0 | 0.0 | 0.0 | 90.0 | 0.0 | 0.0 | 2.0 | 10.0 | 3.0 | 30.0 |
| 2016 | 0.0 | 0.0 | 0.0 | 0.0 | 15.0 | 0.0 | 2.0 | 0.0 | 2.0 | 1.0 | 15.0 |
| 2015 | 0.0 | 0.0 | 0.0 | 0.0 | 7.0 | 0.0 | 0.0 | 0.0 | 7.0 | 0.0 | 1.0 |
| 2014 | 0.0 | 0.0 | 0.0 | 0.0 | 3.0 | 0.0 | 0.0 | 0.0 | 1.0 | 0.0 | 3.0 |
| 2013 | 2.0 | 0.0 | 0.0 | 1.0 | 8.0 | 0.0 | 0.0 | 0.0 | 0.0 | 1.0 | 3.0 |
| 2012 | 4.0 | 0.0 | 0.0 | 0.0 | 4.0 | 0.0 | 0.0 | 0.0 | 0.0 | 0.0 | 6.0 |
| 2011 | 1.0 | 0.0 | 0.0 | 0.0 | 10.0 | 0.0 | 0.0 | 0.0 | 0.0 | 0.0 | 6.0 |
| 2010 | 0.0 | 0.0 | 0.0 | 1.0 | 1.0 | 0.0 | 0.0 | 0.0 | 0.0 | 0.0 | 1.0 |
| 2009 | 0.0 | 0.0 | 0.0 | 0.0 | 1.0 | 0.0 | 0.0 | 0.0 | 2.0 | 0.0 | 2.0 |
| 2008 | 2.0 | 0.0 | 0.0 | 0.0 | 6.0 | 0.0 | 0.0 | 0.0 | 0.0 | 0.0 | 4.0 |
| 2007 | 9.0 | 0.0 | 0.0 | 0.0 | 11.0 | 0.0 | 0.0 | 0.0 | 0.0 | 0.0 | 3.0 |
| 2006 | 1.0 | 0.0 | 0.0 | 0.0 | 5.0 | 0.0 | 0.0 | 0.0 | 2.0 | 0.0 | 2.0 |
| 2005 | 0.0 | 0.0 | 0.0 | 0.0 | 1.0 | 0.0 | 0.0 | 0.0 | 1.0 | 0.0 | 0.0 |
| 2004 | 0.0 | 0.0 | 0.0 | 0.0 | 1.0 | 0.0 | 0.0 | 0.0 | 0.0 | 0.0 | 1.0 |
| 2003 | 0.0 | 0.0 | 0.0 | 0.0 | 0.0 | 0.0 | 0.0 | 0.0 | 1.0 | 0.0 | 0.0 |
| 2002 | 1.0 | 0.0 | 0.0 | 0.0 | 2.0 | 0.0 | 0.0 | 0.0 | 0.0 | 0.0 | 0.0 |
| 2001 | 0.0 | 0.0 | 0.0 | 0.0 | 1.0 | 0.0 | 0.0 | 0.0 | 0.0 | 0.0 | 1.0 |
| 2000 | 2.0 | 0.0 | 0.0 | 0.0 | 1.0 | 0.0 | 0.0 | 0.0 | 0.0 | 0.0 | 2.0 |
| 1999 | 1.0 | 0.0 | 0.0 | 0.0 | 4.0 | 0.0 | 0.0 | 0.0 | 0.0 | 0.0 | 0.0 |
| 1998 | 0.0 | 0.0 | 0.0 | 0.0 | 1.0 | 0.0 | 0.0 | 0.0 | 1.0 | 0.0 | 0.0 |
| 1997 | 0.0 | 0.0 | 0.0 | 0.0 | 2.0 | 0.0 | 0.0 | 0.0 | 0.0 | 0.0 | 0.0 |
| 1996 | 0.0 | 0.0 | 0.0 | 0.0 | 2.0 | 0.0 | 0.0 | 0.0 | 0.0 | 0.0 | 0.0 |
| 1995 | 3.0 | 0.0 | 2.0 | 0.0 | 2.0 | 0.0 | 0.0 | 0.0 | 1.0 | 0.0 | 0.0 |
| 1994 | 0.0 | 0.0 | 0.0 | 0.0 | 1.0 | 0.0 | 0.0 | 0.0 | 1.0 | 0.0 | 2.0 |
| 1993 | 0.0 | 0.0 | 0.0 | 0.0 | 2.0 | 0.0 | 0.0 | 0.0 | 0.0 | 0.0 | 2.0 |
| 1992 | 0.0 | 0.0 | 0.0 | 0.0 | 1.0 | 0.0 | 0.0 | 0.0 | 0.0 | 0.0 | 1.0 |
| 1991 | 0.0 | 0.0 | 0.0 | 0.0 | 2.0 | 0.0 | 0.0 | 0.0 | 3.0 | 0.0 | 1.0 |
| 1990 | 0.0 | 0.0 | 0.0 | 0.0 | 1.0 | 0.0 | 0.0 | 0.0 | 7.0 | 0.0 | 0.0 |
| 1989 | 0.0 | 0.0 | 0.0 | 0.0 | 13.0 | 0.0 | 0.0 | 6.0 | 10.0 | 2.0 | 0.0 |
| 1988 | 0.0 | 0.0 | 0.0 | 0.0 | 16.0 | 0.0 | 0.0 | 6.0 | 14.0 | 3.0 | 0.0 |
| 1987 | 0.0 | 0.0 | 0.0 | 0.0 | 1.0 | 0.0 | 0.0 | 8.0 | 4.0 | 0.0 | 0.0 |
| 1986 | 0.0 | 0.0 | 0.0 | 0.0 | 0.0 | 0.0 | 0.0 | 0.0 | 0.0 | 0.0 | 0.0 |
| 1985 | 0.0 | 0.0 | 0.0 | 0.0 | 1.0 | 0.0 | 0.0 | 0.0 | 1.0 | 0.0 | 0.0 |
| 1984 | 0.0 | 0.0 | 0.0 | 0.0 | 1.0 | 0.0 | 0.0 | 0.0 | 0.0 | 0.0 | 1.0 |
| 1983 | 0.0 | 0.0 | 0.0 | 0.0 | 0.0 | 0.0 | 0.0 | 0.0 | 0.0 | 0.0 | 0.0 |
| 1982 | 0.0 | 0.0 | 0.0 | 0.0 | 0.0 | 0.0 | 0.0 | 0.0 | 0.0 | 0.0 | 0.0 |
Distribution map
Distribution - 2017
This map shows the observed distribution of the Masked Lapwing for 2017.
The red circles are the grid cells where Masked Lapwing have been reported.
The transparency of the red circles indicate how many surveys sheets were submitted for that grid cell; the darker the red the more reliable the data. Of the 315 grid cells with reports, 83 had only one sheet; an example is grid number D26.
The size of the circle represents the reporting rate. The maximum reporting rate for Masked Lapwing was 100.0% (eg grid number D26) and the minimum was 0.2% (eg grid number K16). 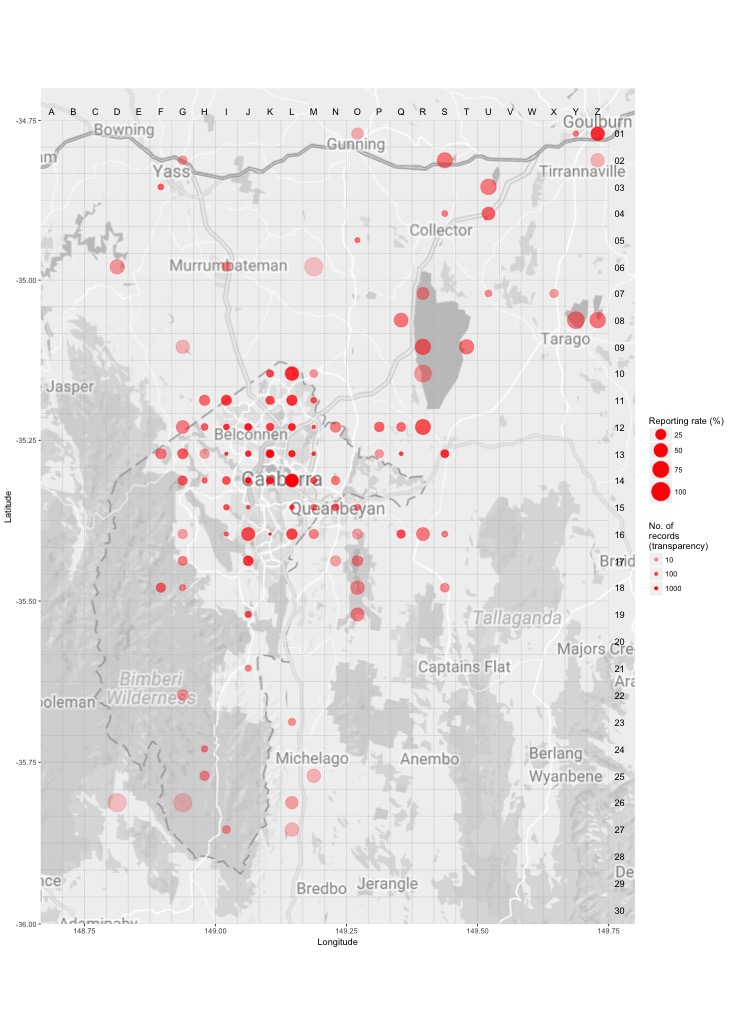
Distribution - all years
This map shows the observed distribution of the Masked Lapwing for all years.
The red circles are the grid cells where Masked Lapwing have been reported.
The transparency of the red circles indicate how many surveys sheets were submitted for that grid cell; the darker the red the more reliable the data. Of the 703 grid cells with reports, 55 had only one sheet; an example is grid number B13.
The size of the circle represents the reporting rate. The maximum reporting rate for Masked Lapwing was 100.0% (eg grid number B13) and the minimum was 0.5% (eg grid number M13). 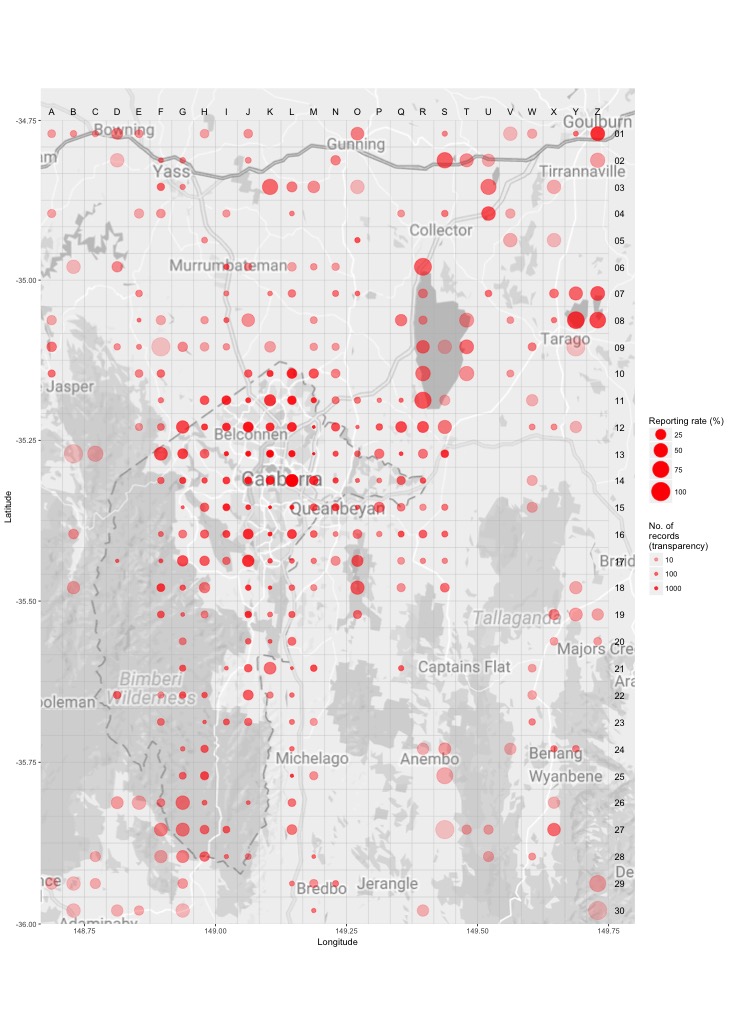
Breeding map
Breeding - 2017
This map shows the breeding distribution of the Masked Lapwing for 2017.
The red circles are the grid cells where breeding activity for Masked Lapwing have been reported.
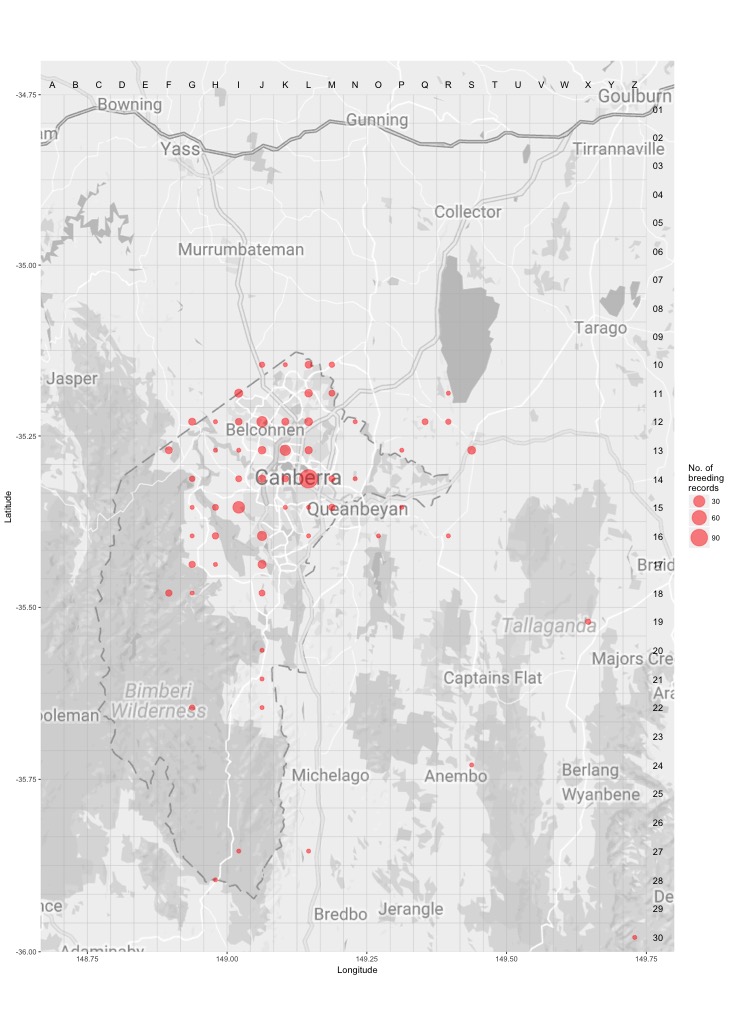
The size of the circle represents the number of reports. 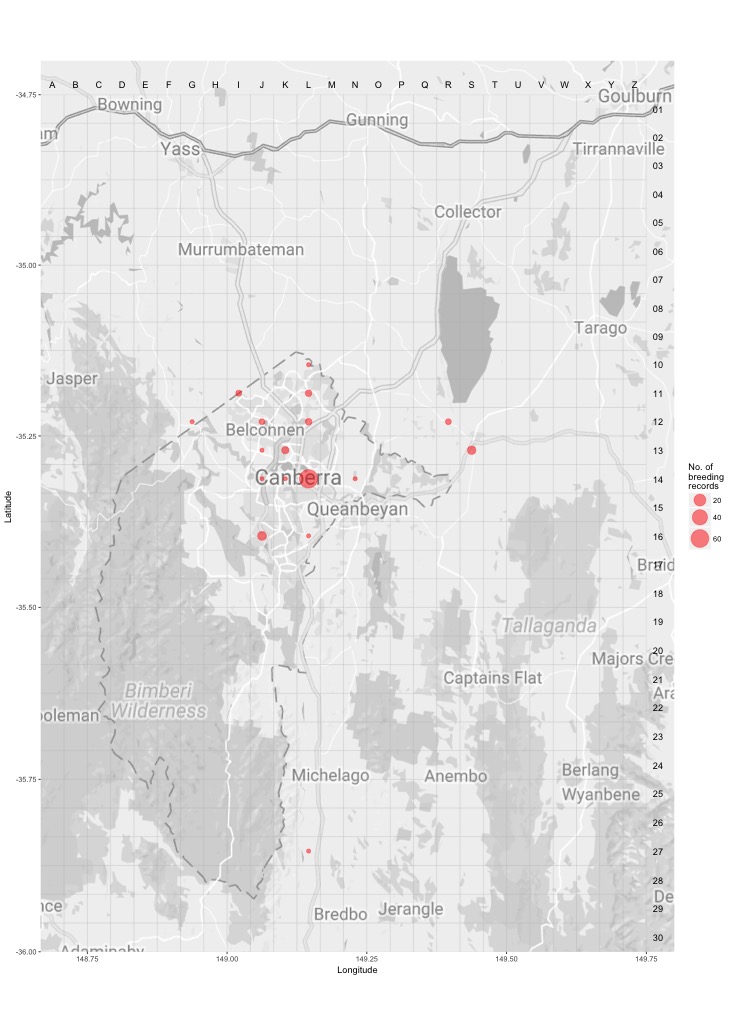
Breeding - all years
This map shows the breeding distribution of the Masked Lapwing for all years.
The red circles are the grid cells where breeding activity for Masked Lapwing have been reported.
The size of the circle represents the number of reports.